Analyze the Critical Exadata Systems
From the Exadata System Capacity Planning dashboard, you easily identify systems that are projected to reach high utilization. You can then drill down into individual systems for a detailed look at system resources to identify specific issues.
For each Exadata System, you can get a detailed look at the following resources:
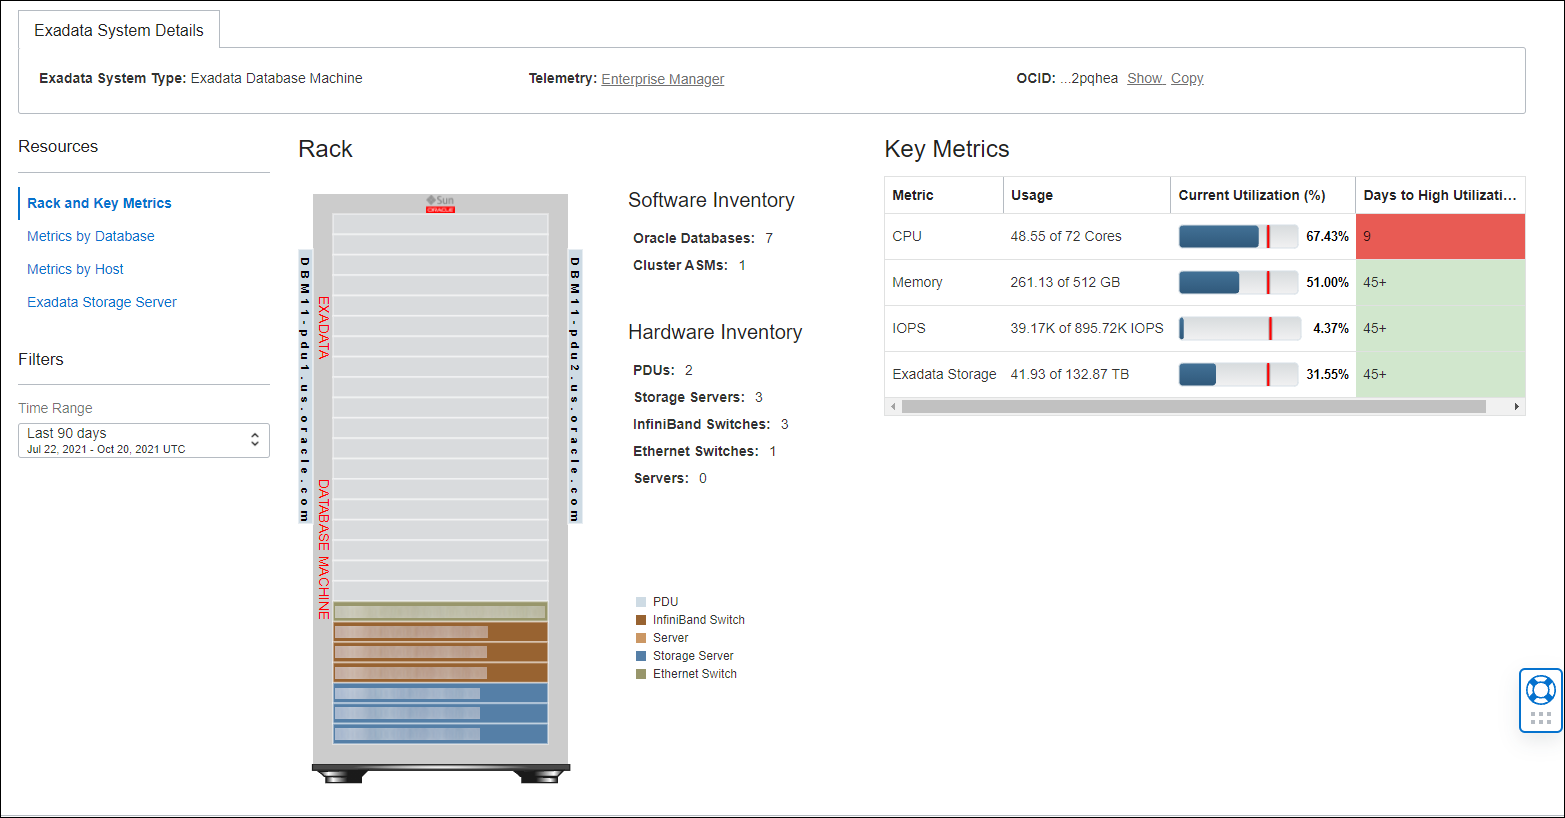
Rack and Key Metrics
This provides you with a detailed look at the components of the rack such as Software Inventory (Oracle Databases, Clusters, etc.) , Hardware Inventory (PDUs, Storage Servers, InfiniBand Switches, Ethernet Switches, and Servers) and all key monitoring metrics for the system (Exadata Storage, CPU, IOPS, and Memory). The values shown represent the 90th percentile of the daily averages (if you are looking at 7 days or less data this would be the 90th percentile of the hourly averages).

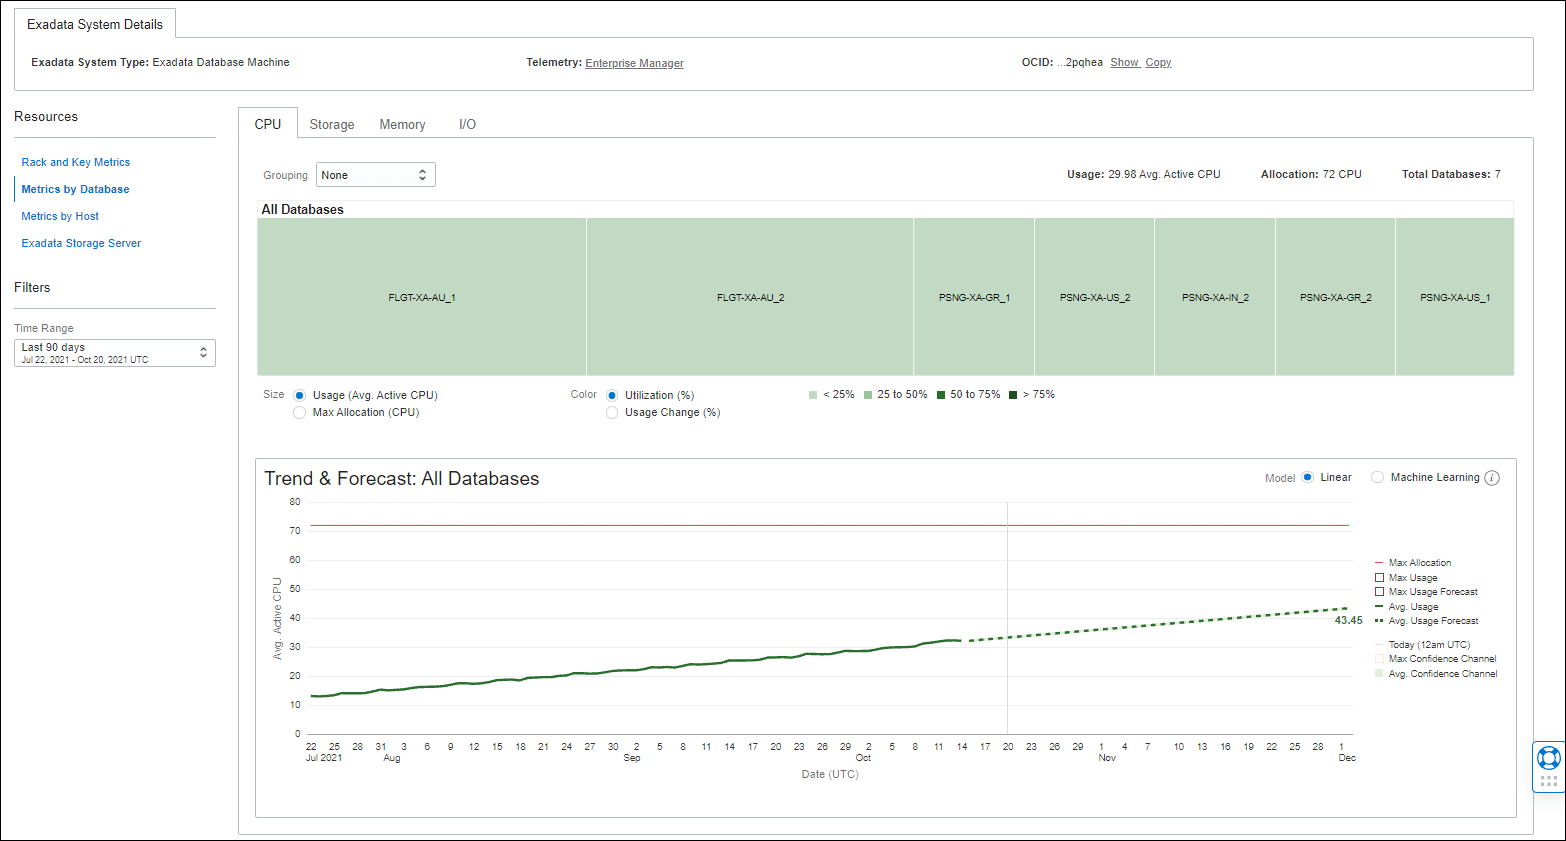
Metrics by Database
This provides a detailed look at CPU, Storage, Memory, and I/O utilization across all databases in the system. The volume of resources used and the percentage change are represented visually, through the size and color of the cells, respectively. Cells that are larger in size use more storage resources than smaller cells. The largest cell would be that of the databases using the most resources. The color of the cells is determined by the percent utilization (highest utilized) in the storage resources used by the databases.

To analyze resource utilization across a subset of databases, use the Group menu to group databases according to CDB, HOST, Database Type, Utilization Level, CDB, Host, VM Cluster (All Exadata Database Services discovered with Enterprise Manager 13.5 Release Update 8 [13.5.0.8] onward), Freeform Tags, or Defined Tags. Click on a specific group to view the trend and forecast for resource utilization for all databases within the group. For more information on group tags see: Group by Tags.
For Ops Insights to forecast your resource utilization for a year, there must be at least 12 months of stored data. The forecast value is more accurate when there’s more data.
The 0–25% resource utilization is considered as low utilization, and 75–100% utilization of resources is considered as high utilization.
You can use the Trend & Forecast utilization chart to plan your database resource capacity.
To verify trend accuracy for both Exadata databases and hosts, you can compare historical data with forecasted trends using Forecast Backtesting. See Forecast Backtesting for more information.
For Virtualized Exadata systems the CPU and Memory metrics shown are for the Virtual Machine.
Exadata Storage Server: This provides you with a detailed look at individual clusters and diskgroups that comprise the Exadata Storage Server. Total Usable Storage is shown for each cluster, in addition to IOPS and Throughput.
You can view data as Individual data series in order to view trends for separate diskgroups/storage servers, or Aggregate data series and forecast where you can view a summed total of diskgroup/storage server data that provides insight into the overall performance of the cluster instead of individual diskgroups or storage servers.
Analyzing an Exadata System
You can analyze the CPU, memory, and I/O resources that are capacity bottleneck using the forecasted data. Use this information to identify the top databases consuming host CPU, memory, storage disk, or I/O resources.
To resolve a capacity bottleneck:
- Relocate the high resource consuming databases.
- Find if the CPU usage increment is caused by bad SQL.
- Consider adding more servers.