Analyze Database Performance
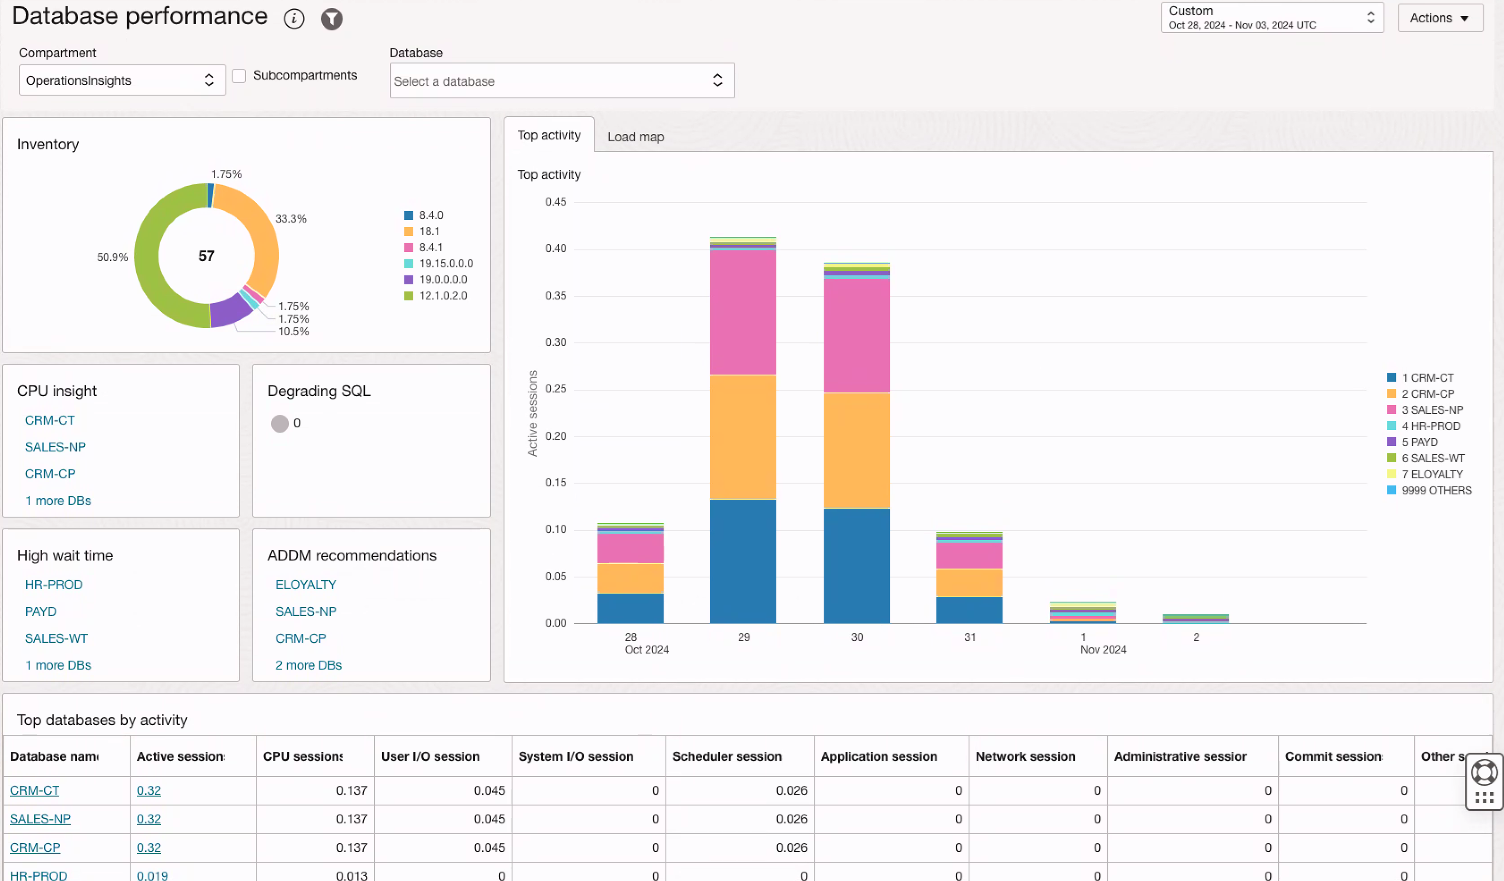
With the Database Performance dashboard you can gain insights into your fleet's database performance with a comprehensive fleet-level view. Track the overall workload, identify databases with the highest workload, and pinpoint actionable areas for optimization. View granular information into specific databases top activities and ADDM recommendations.
To access the Database performance dashboard, navigate to Ops Insights, from the main menu select Database Insights and click on DB Performance. This will load the Database performance dashboard.

At the top bar of the Database performance dashboard select the Compartment to view, check mark Subcompartments if you want to view child compartments in the performance insights. Then select the Database and Time range (7 days, 30 days, 90 days, 6 months, or custom). This will allow you to filter the data presented in the tables below.
- CPU insight: Databases shown having excess database time, and/or scheduler wait time exceeding 1% of total database time. This insight is indicative of databases with saturated CPU's or the Resource manager CPU-limiting some consumer groups.
- Degrading SQL: Databases having SQL with a degraded response time.
- High wait time: Databases where non IO (Input-Output) wait time has exceeded 50% of the database CPU time.
- ADDM recommendations: ADDM spotlight recommendations for the selected databases that will result in high performance improvement benefits.
The main graph area shows two tabs Top activity and Load map. The Top Activity chart details a breakdown of total fleet database time over the selected time period. It will show the top 7 busiest databases in units of average active sessions. The Load map displays a treemap of the total database time over the selected time period.
The table at the bottom of the dashboard shows the Top databases by activity, allowing you to see the list of top 10 databases by active sessions.