Jobs
There are five options available in the Jobs menu: Summary, Running, Forecast, History, Notifications. Each option is described below.
Summary
At the top, the Summary page provides an overview of the total number of Failed, Blocked, Chain stalled, Resource unavailable, Broken, and Retry Scheduled jobs. Click a job tile and the corresponding list of jobs are displayed in tabular format below. Remove the filters to display all scheduled jobs.
To create a job, see Create or Edit Job.
The Actions icon is available at the end of each job row. Click Actions to view the following list of options:
-
Job
-
Run: Runs the specific job.
-
Edit: See Create or Edit Job.
-
Drop: Drops the specific job.
-
Job-Enable/Disable: If enabled is selected, the job is picked up by the Scheduler for processing. The status of the job (enabled or not) is seen in the Job Details page, where the property “enabled” displays TRUE or FALSE.
-
- History
-
Report: Provides a history of the job runs in a report format, including log details, status of the run, run duration, errors if any, and so on.
-
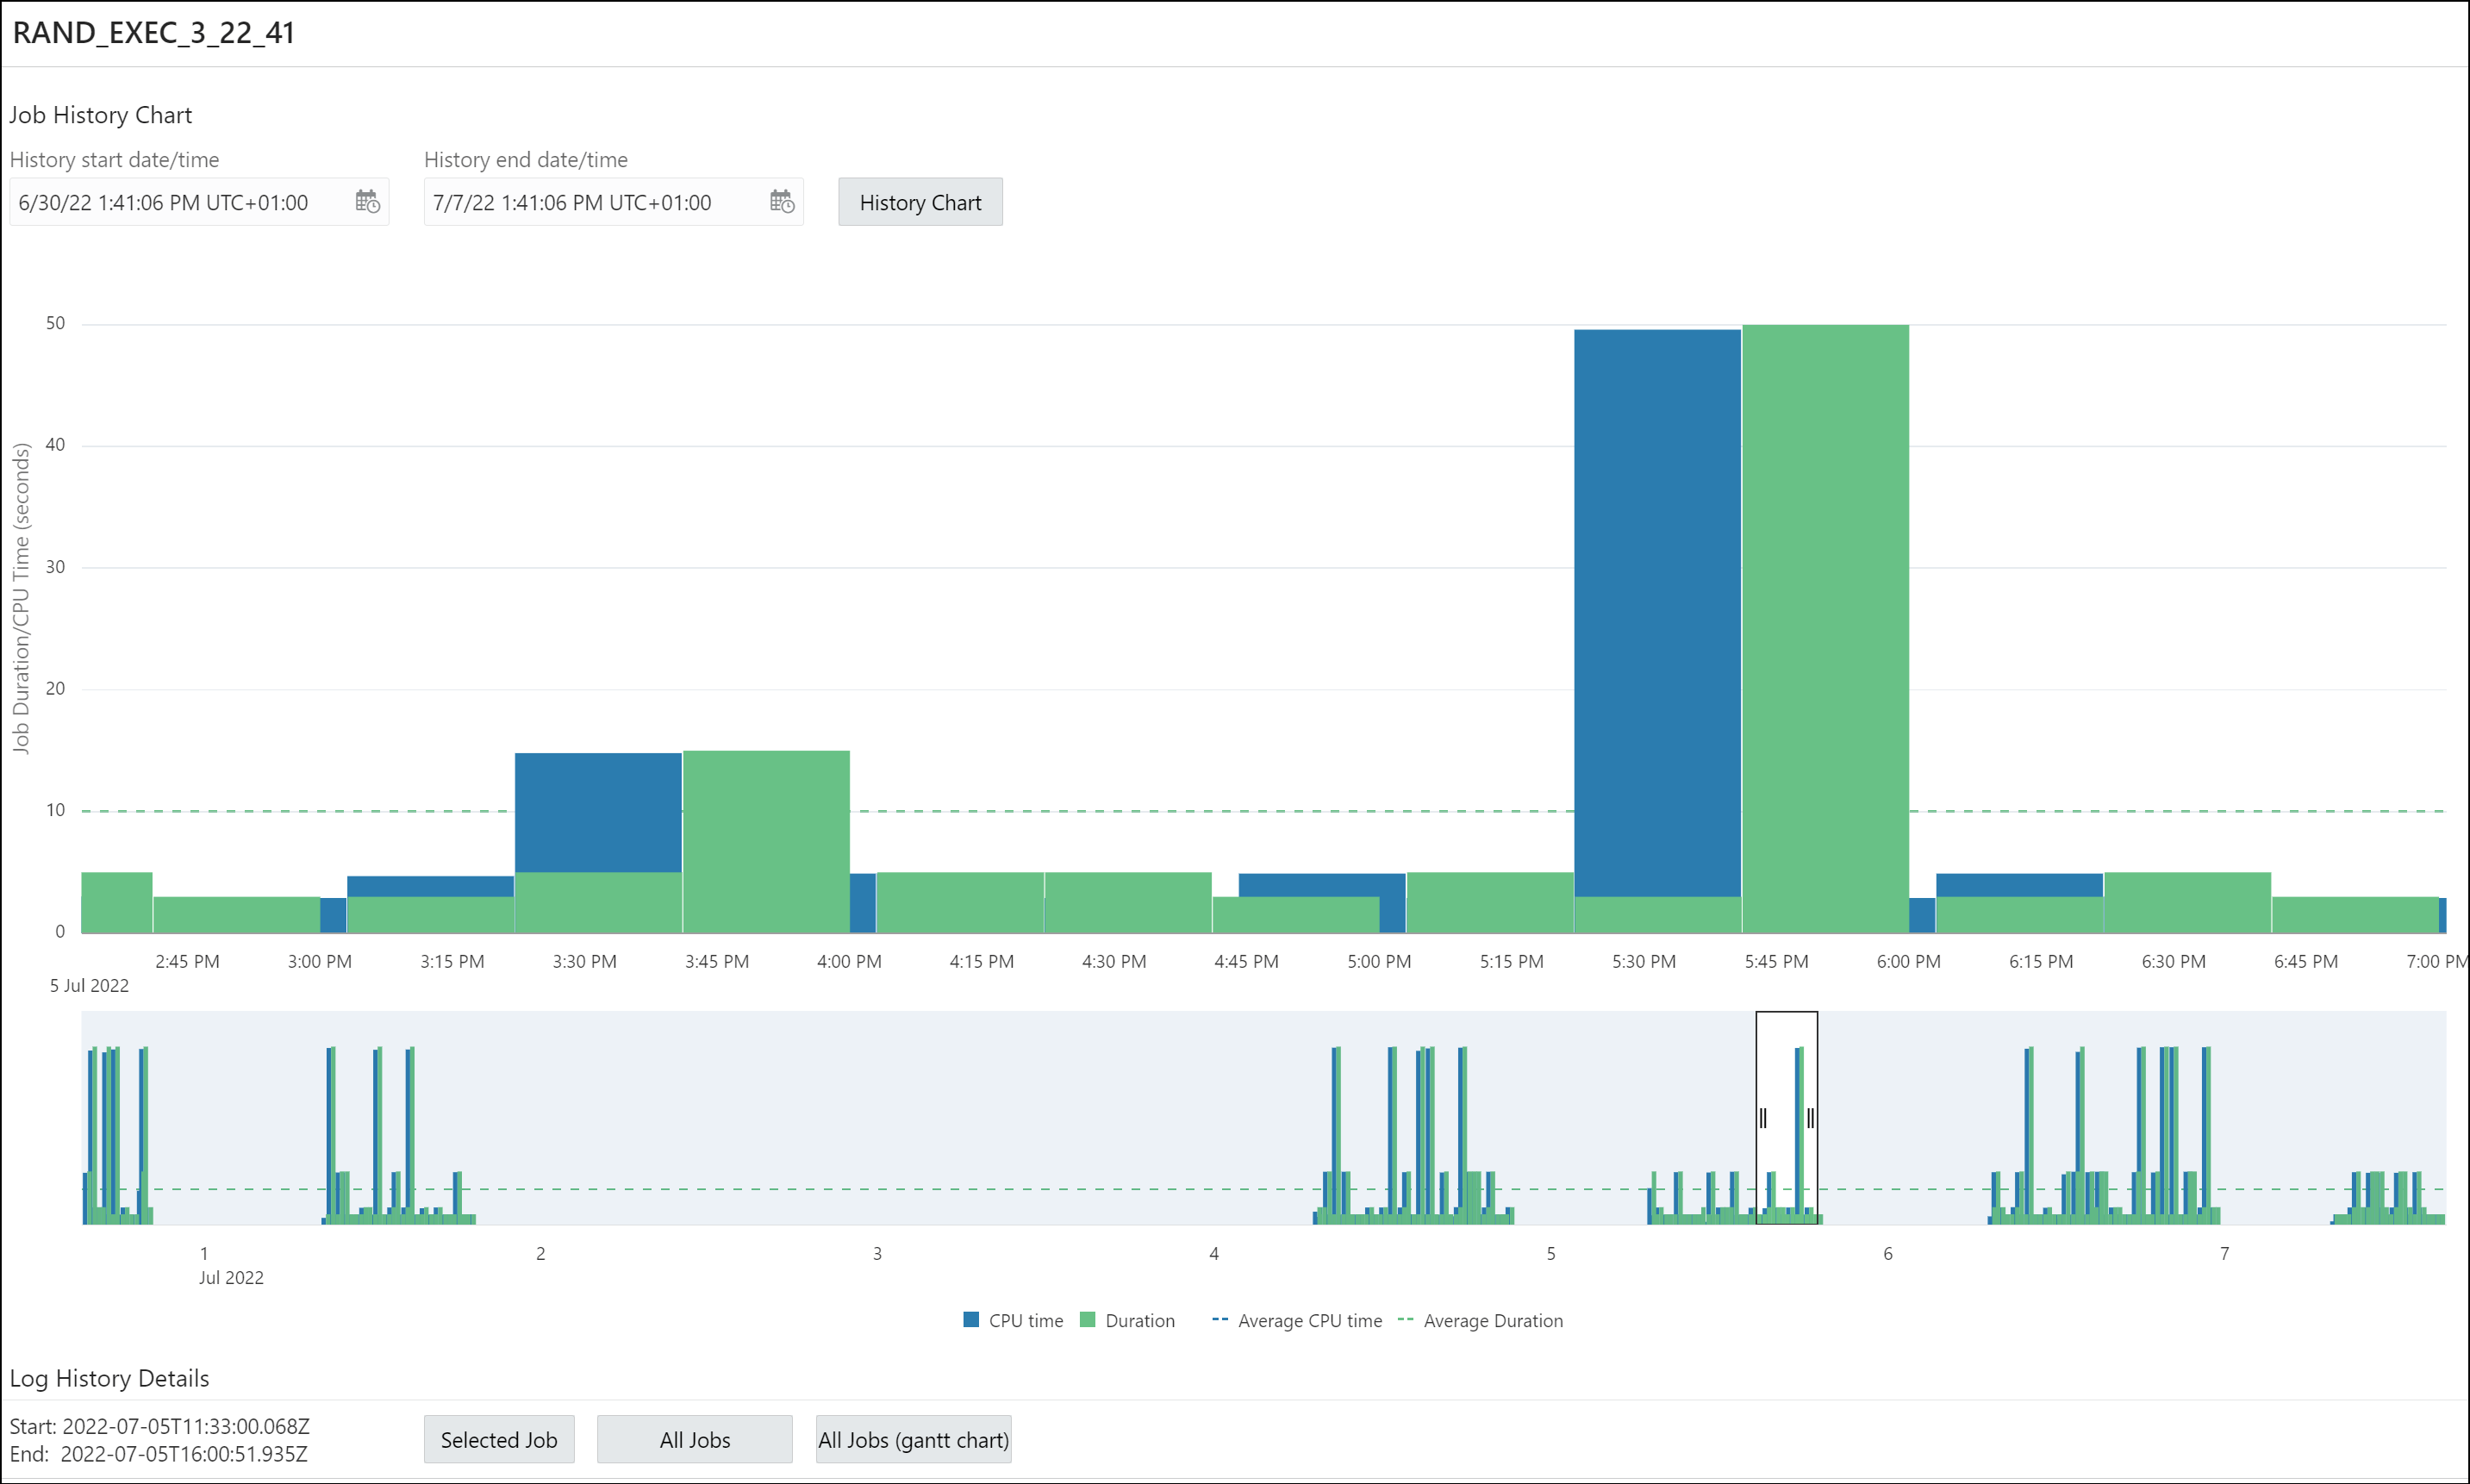
Chart: Provides a history of the job runs in a visual bar chart representation. Run duration and used CPU time are presented for each execution. Jobs in chains are presented with aggregated information for the whole job. There is an overview scrollbar that enables zoom and scroll by changing the time frame. You can display all details from logs for that time frame for a selected job or for all jobs. Also, a Gantt chart can be shown for all jobs for a selected time frame.

-
-
Job Forecast: You can execute the job forecast functionality for a single job (available in the Action menu) or for a set of jobs (available on the toolbar for the table). For a set of jobs, filtering can be used to narrow the set of jobs. Use Ctrl key+click to select some jobs and then Job Forecast will run for the selected jobs only. If there are no selected jobs, then forecast will run for all listed jobs. Not every job included in the set is included in the final forecast. Only jobs with a defined calendar (repeat interval) are included. You can define the calendar inline or using schedule, window or window group. After the forecast is done, you can select different zoom levels and filter the results by schema.
- Job Details: Displays job attributes, such as action, job class, type, schedule, and so on. Select JSON to view the attributes in JSON format. Depending on the job’s definition, details about used objects are provided such as used program, PL/SQL code, procedure, procedure dependencies, program arguments, job arguments, job class, schedule, window, window group together with windows in the group, file watcher, history chart presenting one week of history from last start date.
Running
The Running page displays the list of currently running jobs. The following commands are available: Stop, Edit, History, Job Details.
History
The History page displays log run details for all Scheduler jobs available to the user. You can use the History window and set filters to limit the amount of data. You can filter using delayed jobs by providing a delay interval. Ordering is supported on the grid by clicking the column header.
Forecast
The Forecast page provides the job execution forecast for all available jobs. This operation takes time to finish depending on the number of jobs and forecast interval. Forecast for all available jobs depends on the rights of the connecting user. After execution, you can filter the results based on the schema of the jobs.
The Forecast functionality is also available on the Jobs - Summary page. In that case, it works on the list of available jobs. You can filter the jobs before the forecast functionality is used. If there is a selection of jobs, then the functionality uses only the selected jobs.
History (Gantt Chart)
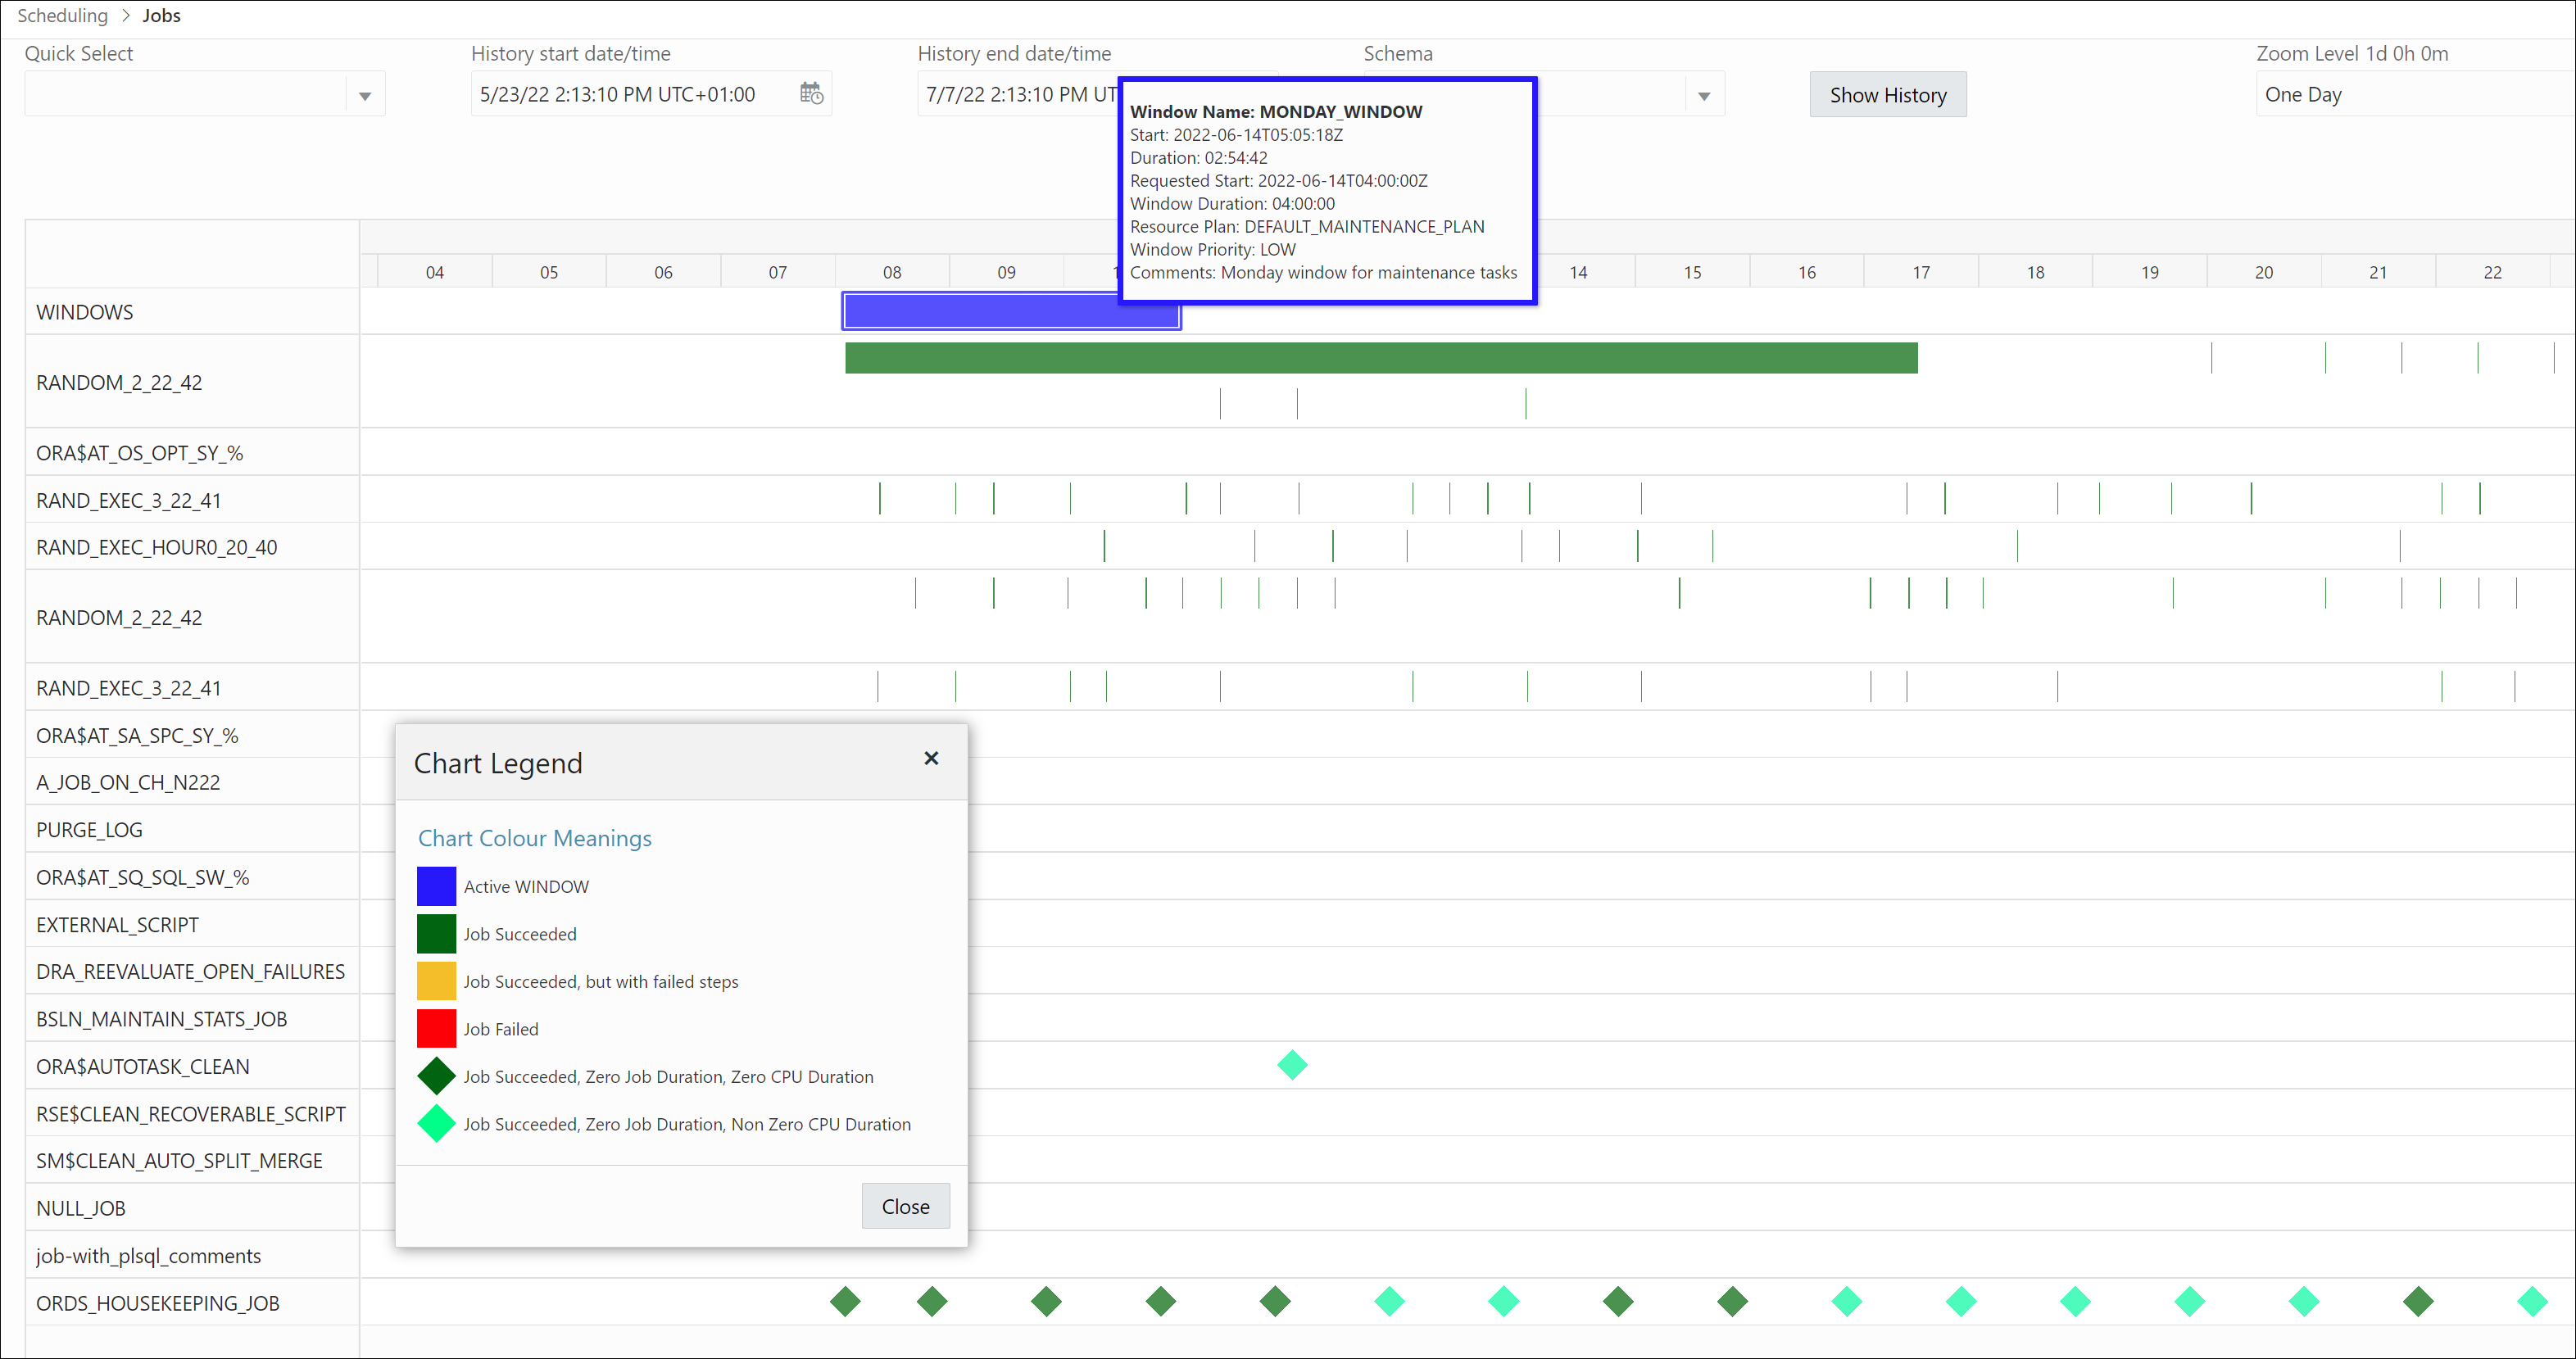
History represents windows and job execution history in the form of a Gantt chart. The windows activation history is shown on the first row. Jobs are ordered in a descending order based on the maximum used CPU time. Details are shown for each window activation and job execution. The job summary is available when hovering over the label of a job's row.

Notifications
You can create notifications only if an email server is set for the scheduler.
The Notifications page enables you to view, create, edit and delete notifications related to job events. Also, you can see email server details by clicking the Notifications Email Server icon at the top right of the page.
For each message, you can specify job, recipient email addresses and sender (or no sender), and you can modify the subject and body of the message and set the filter condition. If multiple recipients and events are provided, then Oracle Scheduler creates a separate notification record for each combination <recipient,event>. You can edit the content of a set of notifications created in this way by using Edit Aggregated, which appears in the context menu of each notification. Edit edits the content of a single notification.
Notifications can be filtered by job name, job owners, recipients and events. You can select and remove some notifications by clicking the Remove Notifications icon. If there are no selected notifications (use Ctrl+click to deselect a single notification), then the Remove Notifications dialog appears enabling removal of all notifications for the selected job, or job and recipients, or job and events, or job and events and recipients.