About the Data Modeler Editor
You can create and work with relational diagrams in the editor pane.
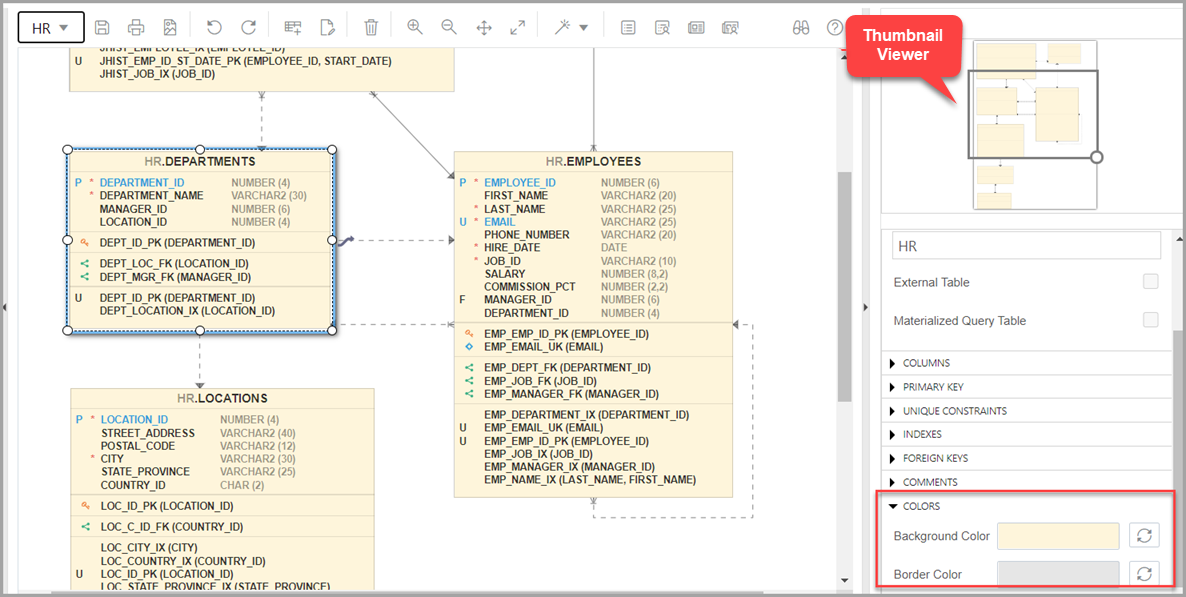
When an object is selected in the diagram, you can inspect the properties of the object in the right pane. For a table, the properties displayed are Columns, Primary Key, Unique Constraints, Indexes, Foreign Keys, Comments, and Colors. The only properties that you can edit are background and border color. Click the Reset icon to return to the default colors.
The following figure shows the properties of an object selected in the editor pane.
You can drag the thumbnail viewer in the upper right corner to display the appropriate area in the editor pane. This is useful when you are working with long diagrams in the editor pane.

When creating diagrams, you can do the following:
-
Select an object and then drag to move it around.
-
Adjust or move objects with the relationships intact.
-
Add elbows to relationship lines to avoid intersecting with lines from other objects. Right-click the relationship line and drag to create the elbow. Click Remove vertex
 to restore the original shape.
-
Resize objects by dragging the handles that are positioned around the box.
-
Select and then right-click an object for the following options:
-
DDL Preview: Shows the DDL statements for the object.
-
Update: Updates any actions performed on the object.
-
Delete: Deletes the object.
-
Edit: Opens the Table Properties Dialog for editing a table object or the View Properties Dialog for a view object.
-
Implied Foreign Keys: Opens the Implied Foreign Keys Dialog. Use this option to define implied foreign keys for the object. See Implied Foreign Keys
-
View JSON Data Guides: Opens the JSON data guide diagram for the table or view. See About Viewing JSON Data Guides
-
The icons on the toolbar are:
-
Save Diagram: Saves the currently selected diagram. Diagrams are stored in a table that is created in the schema of the user.
-
Print Diagram: Prints the selected diagram.
-
Save to SVG: Saves the currently selected diagram to an image file in SVG format.
-
Add Objects to Diagram: A dialog is displayed where you can select one or more objects of type tables or views from a specific schema into the selected diagram. Type
*to list all the objects of an object type (tables or views) in the schema. You can also search by typing a few characters. -
Add Note: Adds notes to the selected diagram. Select the note to add text and to see the associated properties in the right pane, such as Font Size and Colors.
-
To enter text, expand TEXT and type information. Click Apply.
-
To select the background, border, or text color for the note, click the box and select the required color. To revert to the default color, click Reset
 .
.
-
-
Delete: Deletes the selected object or objects from the diagram. To select multiple objects, press the CTRL key and select the objects.
-
Zoom In: Displays more detail, and potentially fewer objects, in the currently selected diagram.
-
Zoom Out: Displays less detail, and potentially more objects, in the currently selected diagram.
-
Fit Screen: Makes all relevant objects fit in the window for the currently selected diagram, adjusting the sizes of shapes and text labels as needed.
-
Actual Size: Adjusts the shapes and text labels in the currently selected diagram to the default sizes.
-
Layout: Auto Layout: Rearranges the objects in the diagram to a layout that may be more meaningful and attractive. If you do not like the rearrangement, you can restore the previous layout by clicking Undo.
-
Layout: Star Layout: Rearranges the objects in the diagram to a star schema layout, where the fact table is in the center and the associated dimension tables surround the fact table.
-
DDL Preview: Shows the DDL statements for the object. You have the option to save or send the DDL statements to the worksheet. To choose what you want to display, click Options.
-
DDL Preview for Current Schema: Shows the DDL statements for the current schema. You can send the DDL statements to the worksheet.
-
Diagram Report: Generates a data dictionary report of everything in the diagram.
-
Schema Report: Generates a data dictionary report of everything in the schema.
-
Help: Displays the help for the Data Modeling editor.