Browser Agent Spans - Metrics Explained
This section provides information about spans from the browser agent and how it reports and manages timing in different phases.
When using the browser agent, there are technical details on how different timings are derived from data that the browsers provide to the browser agent.
Background
Different spans, such as page load, page update and Ajax calls, report timing in four separate sequential phases:
- Init phase
- Firstbyte phase
- Download phase
- Render phase
The below sections provide details and explanation to improve the understanding of where the data originates, where the delay occurs and which component/teams are most likely helpful to address the performance issue.
Init time: When a lot of time is consumed in the init phase, it could point in the direction of connection setup/JavaScript code that it's executed to initiate the span. Further analysis could start by looking more closely at Connection spans that provide details on DNS/SSL/Connection timings for same endpoint.
Firstbyte time: The firstbyte phase relates to the time after the init phase was completed until the first byte is received. When multiple Ajax calls are executed in parallel for page update, the first of them that returned will be used. In the case of page load, this timing relates to the HTML of the page. A large first byte time indicates that the server generating the content needs much time to produce the output. For example, this can be fixed by producing the response in a more chunked way.
Download time: The download time is the time after the first byte until the relevant data is loaded. In the case of page updates, this relates to the completion of all Ajax calls. For the page load, it relates to the content ready to display. A long delay indicates that the content is large, and requires much time to be send over the internet. A fix could be the use of compression, or simply reduction of actual content. For example, removal of comments, minify JavaScript or smaller size images.
Render time: The render time is the time after the download until the activity is ready. When a lot of post processing is happening, this will slow down the render time.
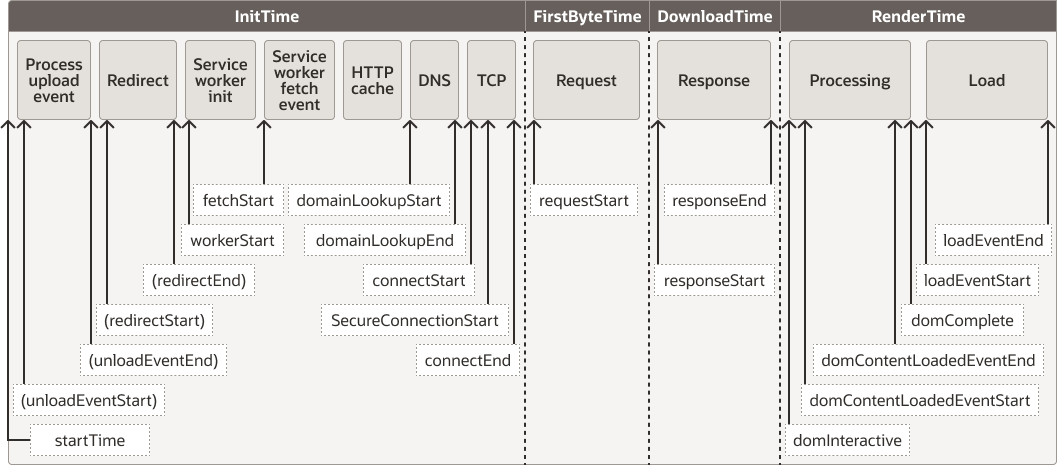
Page Load Timings Related to W3C Navigation Timing
The W3C consortium created a standard for browsers to provide the timings related to loading a page. The details are available in Navigation Timing Level 2 - Processing Model.
Figure 5-5 Page Load timings related to W3C navigation timing

- InitTime = requestStart - startTime
- FirstByteTime = responseStart - requestStart
- DownloadTime = responseEnd - responseStart
- RenderTime = max(domContentLoadedEventEnd, domComplete, loadEventEnd) - responseEnd
The initTime related details for the connection setup are captured in the connection span. These connection spans are aggregated by host (since each host needs a separate connection). The connection timings can help to identify the performance bottleneck, such as DNS, SSL and tcp-connection. This is done for both initial HTML as any object on the page, when that requires a separate connection, for example, to some external CDN or service.
The interactive time (domInteractive) is tracked as separate timing metric: PageInteractiveTime.
Page Update Timing with Respect to Ajax Calls
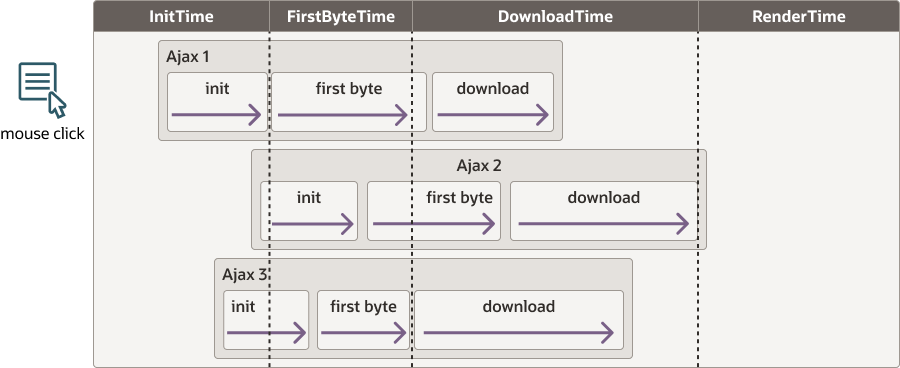
For page updates the following graph could help to visualize the impact of different Ajax calls that are triggered from a single user-action. The browser waits after every user action for a few seconds to check if an Ajax/error/span is triggered in relation to that action, before reporting the action in isolation as a click.
Figure 5-6 Page update timing regarding Ajax calls

In the visualization, the init starts on the mouse-click. The firstByteTime starts when one of the Ajax calls receives it's first byte (Ajax 1 from the above image). That is also the moment the download starts. The download ends when all the Ajax calls are done. The Ajax call render time is most often 0, but if there is some render time (e.g. promise handling of a fetch) then that post-processing will be accounted into the download time. The render time starts when all Ajax calls are completed, and captures the time until the page is ready.
Ajax Call Timing Split Up
The Ajax call phases are tracked slightly different for XHR and fetch calls since their characteristics require different ways to normalize this. There is no way to capture the render time for Ajax calls.
XHR Timings
The XHR call consists of the creation of the XHR object (new XMLHttpRequest()). This object instance creation marks the start of the XHR. The object has a send call which marks the end of the init phase, and triggers the start of the firstByte phase. The onReadyStateChange handler is monitored for the receiving of the response headers. As soon as these are in the firstbyte phase is marked end, and the download starts. The moment all data is in the Ajax call is marked complete and the download phase finished.
Fetch Timings
A fetch based Ajax call consists of a call of the fetch method which returns a promise of a result. The call triggers the init of the request. The fetch call could have some logic that initializes the request (which could trigger some JavaScript processing for initialization of the request). This is tracked as the init time, until the real fetch call can be triggered. The fetch response is closely watched, and as soon as something comes back as a response, that will be marking the first byte time. The resulting promise could be chained therefore the returned promise logic is closely watched when it is provided down stream to get the download time accurately in this scenario. When the promise is fullfilled, the Ajax call is marked complete and the download phase finished.
Connection Timing Details
Connections are re-used by the browser, especially when the server supports HTTP2. This makes tracking of the connect time in isolation (separate from page load) more useful. The browser aggregates data based on the endpoint (hostname, protocol and port) that serves the content (HTML/images/style-sheets/JavaScript). The main purpose of these timings is to identify potential slow resources that can impact the perceived latency of loading the page. The basis of the information is the ResourceTiming that browsers provide. For details, see https://developer.mozilla.org/en-US/docs/Web/API/PerformanceResourceTiming.
Figure 5-7 Connection timing details
