View Service Topology
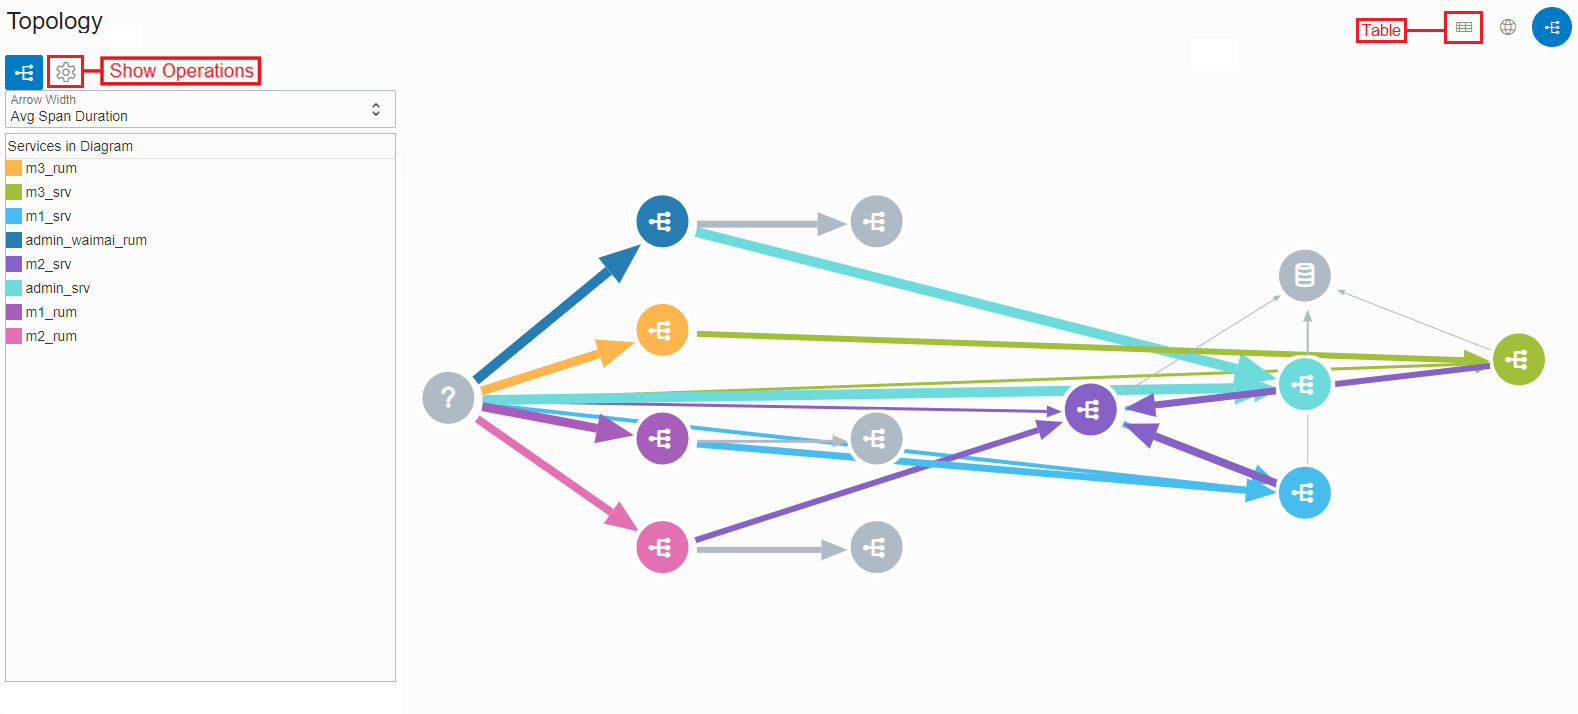
You can view the call relationships between services or operations in a set of queried traces or spans in the Topology view in Trace Explorer.
The information visualized in the Topology view is based on a topology query,
which can either be an out-of-the-box query or a custom query entered manually. Note
that if the out-of-the-box or custom query has the group by clause,
then the Topology view is not displayed.
The Topology view provides an overview of all the services or operations in a
set of traces and enables you to focus on a particular service or operation, its call
relationships, and the metrics generated in each call. Application Performance Monitoring builds the topology based on the parent-child
relationship of individual spans. To begin exploring the Topology view and its features,
click the Traces Quick Pick button and then click the
Topology icon (![]() ). On doing so, you'll notice that the syntax of the out-of-the-box query in the
Traces quick pick has changed to include the clauses that
constitute a topology query:
). On doing so, you'll notice that the syntax of the out-of-the-box query in the
Traces quick pick has changed to include the clauses that
constitute a topology query:
TOPOLOGY FOR NODES BY <Specifies the nodes to aggregate the traces or spans. Typically, traces or
                        spans are only aggregated by serviceName or serviceName and operationName.>
SOURCE <TRACES | SPANS> WHERE <clause> ORDER BY <clause> FIRST <n> ROWS
AGGREGATE LINKS BY <Specifies the metrics to be displayed for calls.>
ADD FINAL LINKS <Displays spans that represent calls to external services or databases, if specified.>
INCLUDE ROOTS <Displays arrows that represent the initial call to each root span.>
SOURCE queries traces or spans to select the traces that
will be used to build the topology. Note that by default, only the top 100 traces are
displayed in the topology, however, you can add FIRST <number>
ROWS to the query to visualize a summarized topology of up to 200,000
traces.
Based on the topology query in the Traces quick pick,
the services in the queried traces are displayed by default. The different colored nodes
correspond to the monitored services in the trace that are also listed in the
Services in Diagram legend, which can be viewed by clicking
the Show Diagram Controls icon (![]() ). The gray nodes denote unknown clients or the external services or databases
that are not monitored. The arrows between the nodes denote calls and you can hover the
mouse over them to view the from and to services and the metrics, as
specified in the query.
). The gray nodes denote unknown clients or the external services or databases
that are not monitored. The arrows between the nodes denote calls and you can hover the
mouse over them to view the from and to services and the metrics, as
specified in the query.
To view the operations in the trace in the Topology view, click the
Show Operations icon (![]() ). In this view, all operations from the same service are in the same color, and
when you hover the mouse over the arrows, the from and to service:
operation are displayed, along with the metrics specified in the query.
). In this view, all operations from the same service are in the same color, and
when you hover the mouse over the arrows, the from and to service:
operation are displayed, along with the metrics specified in the query.
Here's an image of the Topology view, which shows the services in a set of queried traces.

In the Topology view, you can:
- Select a metric in the Arrow Width drop-down list and the width of the arrows changes depending on the metric value. The calls with a higher value for the selected metric are denoted by a thicker arrow.
- Right-click in the white space to view a menu with options that allow you to show or hide specific types of nodes. You can then select the Show All option in the menu to view the entire topology for the query.
- Place the cursor on a node and right-click to view a menu with options that allow you to show or hide the various nodes and call relationships pertaining to the selected node.
- Click a service in the Services in Diagram legend to only view the nodes of that service, and their inbound and outbound calls. Other nodes that are not directly related to the nodes of the selected service are not displayed in the topology. This action can be performed when viewing either services or operations in the Topology view.
In addition, you can click the Table icon (![]() ) in the Topology view to view the calls and metrics displayed in the topology
in a tabular format.
) in the Topology view to view the calls and metrics displayed in the topology
in a tabular format.
To go back to the default view in Trace Explorer from the Topology view,
click the Show recent queries icon (![]() ) adjacent to the query field to view and select a recent trace query, or click
one of the quick pick buttons such as Traces or Trace
Services.
) adjacent to the query field to view and select a recent trace query, or click
one of the quick pick buttons such as Traces or Trace
Services.
View Trace Topology
In Trace Explorer, there are a couple of other options you can use to view the topology of an individual trace.

- Show Trace Details: Select this option to view the topology of the trace and its spans in the Trace Details window.
- Show Trace Topology: Select this option to view the topology of the trace and its spans in the Topology view. This option is displayed if the query supports the Topology view.