Run Direct SQL queries in an Excel worksheet
The Oracle Autonomous AI Databasefor Excel lets you run Direct SQL queries to work with your data in an Excel worksheet.
With the add-in, you can create a table and insert, update and delete rows from the existing tables or views. You can view the results in the current worksheet or different worksheets.
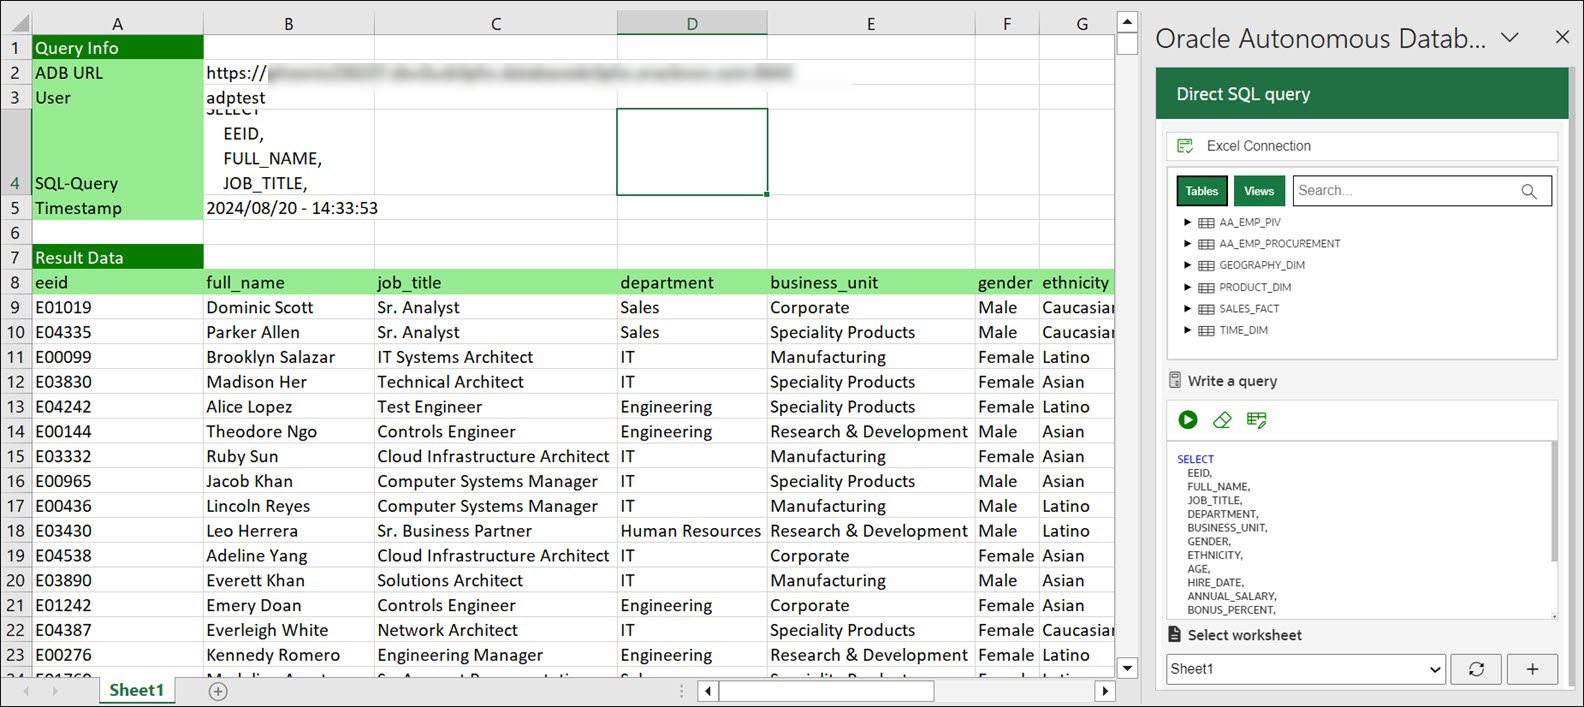
The following image shows your data retrieved from the Autonomous AI Database and displayed in the worksheet. The Query Info section comprising the Timestamp, User name and SQL Query are shown in Excel. You can edit custom queries and run them. The worksheet displays the results of queries from the retrieved data in tabular format.
The add-in maintains a live connection with the database. However, the data retrieved is local to Excel. In case of inactivity, the connection times out, and you must log in again. You can change the active connection from the connections panel. The image shows the results from a single query, but you can insert many queries in a single workbook.
Description of the illustration result-native-sql.png
To run a query using the add-in, run Excel and create a blank workbook using the standard Excel workbook file format.
- In the Excel ribbon, select the Autonomous Database.
- Click the Direct SQL icon from the ribbon. This opens an Oracle Autonomous Database dialog box in the Excel Task Pane with Tables and Views icons and a search field beside them.
- Select Table to view all the existing tables in the schema. Click Views to see the current views in the schema.
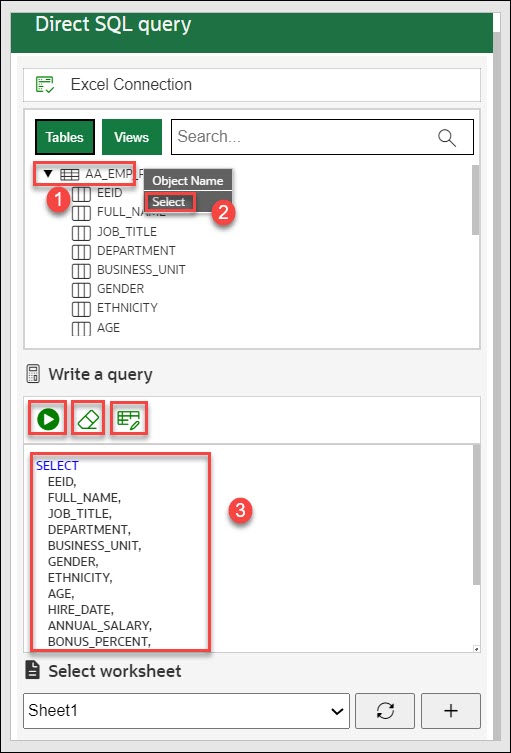
- You can right-click the table whose data you want to query and choose Select to view all the table's columns. The column names will be displayed in the Write a Query section. You can click on the table and view individual columns as well. Click the Run button to run the SQL query in the query editor. The query results will be displayed in the worksheet you select.
Note
You will view an error message if you click the Run icon while the query editor is empty. - You can click + sign beside the Select worksheet drop-down to display the results in a new worksheet.
- The worksheet also displays the timestamp, the user who creates and runs the query and the autonomous database URL.
To run another query follow these steps:
- Click the eraser icon to clear the previous query from the SQL editor and write a new query.
- Click Retrieve query from Sheet to import the SQL query from the existing worksheet and generates that query in the SQL editor.
- In the Select worksheet drop-down, select a new sheet, Sheet 2, in this case. The Add-in adds a sheet for the user. If you work on the same sheet, the Add-in refreshes the data in the existing worksheet.
- Click the Run icon to display the query results.
The worksheet displays the result of the query at a go. While this behavior works for most scenarios, sometimes, for large data sets, the query result might exceed 10K rows. Although you can view the 10K rows, a confirmation window asks if you want to view the rest of the results.

Description of the illustration adp-entire-result-set.jpg
Select Yes to view the entire result set. Loading all the data may take a while. You must fetch all data before working with Pivot tables, or it will lead to incorrect results from aggregation in Pivot tables.
Close the Query Wizard panel to cancel the operation of fetching the result.
Close the Query Wizard panel to cancel the operation of fetching the result.
Parent topic: Oracle Autonomous Database for Excel
